通过ELK集中管理Windows Server日志
什么是ELK
E=ElasticSearch,开源分布式搜索引擎
- 分布式
- 提供了REST API
- 近乎实时搜索
L=LogStash,开源日志收集和过滤工具
- 具有实时管道功能
K=Kibana,开源的web展示
架构和使用场景
环境
软件版本
Oracle Linux 7.5
jdk-11.0.4 (LTS)
nvm
Node.js (LTS)
ElasticSearch 7.4
elasticsearch-head
filebeat 7.4
服务器架构
| Server | IP | OS |
|---|---|---|
| ELK Server | 192.168.1.129 | Oracle Linux 7.5 |
| Windows client | 192.168.1.128 | Windows Server 2016 |
使用场景(TBD)
1) datasource->logstash->elasticsearch->kibana
2) datasource->filebeat->logstash-> elasticsearch->kibana
3) datasource->filebeat->logstash->redis/kafka->logstash-> elasticsearch->kibana
4) kafka->logstash-> elasticsearch->kibana
5) datasource->filebeat->kafka->logstash->elasticsearch->kibana(最常用)
6) filebeatSSL加密传输
7) datasource->logstash->redis/kafka->logstash->elasticsearch->kibana
8) mysql->logstash->elasticsearch->kibana
工作原理
LogStash(TBD)
包括3个模块,输入(inputs),过滤器(filters,可选),和输出(outputs)。
每个模块都可以通过不同的插件进行功能上的增强。
(1)Inputs:用于从数据源获取数据,常见的插件如file, syslog, redis, beats 等[详细参考]
(2)Filters:用于处理数据如格式转换,数据派生等,常见的插件如grok, mutate, drop, clone, geoip等[详细参考]
(3)Outputs:用于数据输出,常见的插件如elastcisearch,file, graphite, statsd等[详细参考]
(4)Codecs:Codecs不是一个单独的流程,而是在输入和输出等插件中用于数据转换的模块,用于对数据进行编码处理,常见的插件如json,multiline[详细参考]
ElasticSearch
Kibana
准备工作
Java
至少需要Java 11,Java 11是LTS版本
安装见 Link
NVM(Optional)
Node.js
Elasticsearch
Elasticsearch文件夹结构
| 文件 | 目录 | 功能 |
|---|---|---|
| elasticsearch.yml | /u01/elasticsearch/elasticsearch-7.4.0/config | 配置文件 |
安装Elasticsearch
Linux版本的Elasticsearch无需安装,解压后直接运行即可
注意:
- Elasticsearch不能用root用户启动
1 | [root@ol75elk74s bin]# mkdir -p /u01/elasticsearch/ |
注意:
- ./elasticsearch -d可以让elasticsearch在后台运行
正常启动的话, 默认端口是9200, 在另外一个窗口运行curl localhost:9200, 可以得到elasticsearch的信息
1 | [root@ol75elk74s java]# curl localhost:9200 |
也可以通过网页访问测试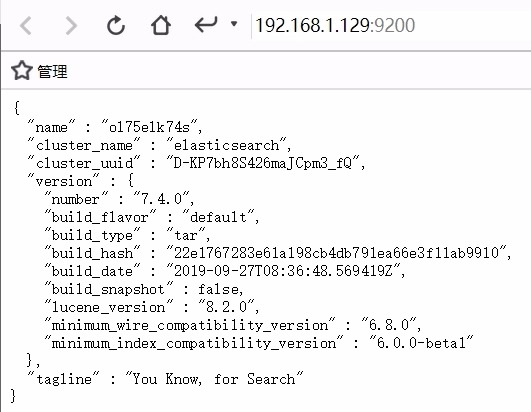
设置环境变量
为了方便,可以将Elasticsearch的bin目录写入环境变量,过程不再累述
重启Elasticsearch
找到相应的进程号,再杀掉该进程
1 | ps -ef|grep elasticsearch |
启动时常规错误
场景 1
1 | [elk@ol75elk74s bin]$ ./elasticsearch -d |
只是一个warning,可以忽略
场景 2
1 | [elk@ol75elk74s bin]$ curl 192.168.1.129:9200 |
授权问题,在配置文件elasticsearch.yml中将network.host参数设为0.0.0.01
2
3
4
5
6
7
8
9
10
11# ---------------------------------- Network -----------------------------------
#
# Set the bind address to a specific IP (IPv4 or IPv6):
#
network.host: 0.0.0.0
#
# Set a custom port for HTTP:
#
#http.port: 9200
#
# For more information, consult the network module documentation.
场景 3
1 | [1]: max file descriptors [4096] for elasticsearch process is too low, increase to at least [65535] |
查看当前系统设置
1 | [elk@ol75elk74s bin]$ ulimit -Hn |
修改到65535
1 | [root@ol75elk74s ~]# vi /etc/security/limits.conf |
增加以下内容1
2
3
4* soft nofile 65536
* hard nofile 65536
* soft nproc 4096
* hard nproc 4096
用户elk重新登陆后生效
场景 4
1 | [1]: max virtual memory areas vm.max_map_count [65530] is too low, increase to at least [262144] |
修改系统文件/etc/sysctl.conf1
[root@ol75elk74s ~]# vi /etc/sysctl.conf
增加如下参数1
vm.max_map_count=262144
使新增参数生效1
2[root@ol75elk74s ~]# sysctl -p
vm.max_map_count = 262144
场景 5
1 | [1]: the default discovery settings are unsuitable for production use; at least one of [discovery.seed_hosts, discovery.seed_providers, cluster.initial_master_nodes] must be configured |
在配置文件elasticsearch.yml中设置cluster.initial_master_nodes参数,指明启动时哪个节点为主1
2
3
4
5
6
7
8
9
10
11
12
13
14
15
16
17
18
19
20
21
22
23
24
25
26
27
28
29
30# ---------------------------------- Cluster -----------------------------------
#
# Use a descriptive name for your cluster:
#
cluster.name: my-elasticsearch
#
# ------------------------------------ Node ------------------------------------
#
# Use a descriptive name for the node:
#
node.name: node-1
#
# Add custom attributes to the node:
#
#node.attr.rack: r1
#
# --------------------------------- Discovery ----------------------------------
#
# Pass an initial list of hosts to perform discovery when this node is started:
# The default list of hosts is ["127.0.0.1", "[::1]"]
#
#discovery.seed_hosts: ["host1", "host2"]
#
# Bootstrap the cluster using an initial set of master-eligible nodes:
#
cluster.initial_master_nodes: ["node-1"]
#
# For more information, consult the discovery and cluster formation module documentation.
#
Elasticsearch-Head插件
Head简介
Elasticsearch的一个可视化前端工具
官方地址:Link
head安装需要使用到git以及node.js的npm,Oracle Linux 7.5自带git
Head安装
下载1
2
3
4
5
6
7
8
9[root@ol75elk74s ~]# cd /u01
[root@ol75elk74s u01]# git clone git://github.com/mobz/elasticsearch-head.git
Cloning into 'elasticsearch-head'...
remote: Enumerating objects: 77, done.
remote: Counting objects: 100% (77/77), done.
remote: Compressing objects: 100% (57/57), done.
remote: Total 4337 (delta 38), reused 45 (delta 17), pack-reused 4260
Receiving objects: 100% (4337/4337), 2.51 MiB | 14.00 KiB/s, done.
Resolving deltas: 100% (2411/2411), done.
安装1
2[root@ol75elk74s u01]# cd elasticsearch-head/
[root@ol75elk74s elasticsearch-head]# npm install
启动1
[root@ol75elk74s elasticsearch-head]# npm run start
访问Head
通过http://192.168.1.129:9100可以访问到elasticsearch-head,elasticsearch-head默认端口9100
修改elasticsearch.yml配置文件
如果不能连接elasticsearch,在elasticsearch.yml配置文件中增加以下两行
1 | http.cors.enabled: true |
保存后重启elasticsearch
连接成功下图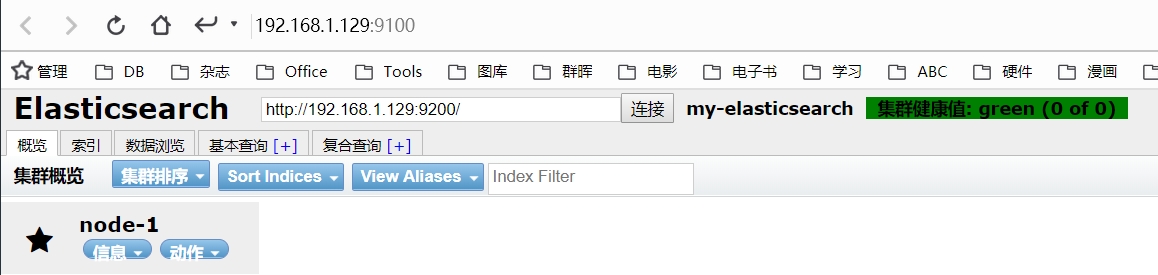
后台运行Head
通过nohup npm run start &命令在后台运行head插件1
2
3
4
5
6
7
8
9
10
11
12
13
14
15
16
17
18
19
20
21
22
23
24
25
26
27
28
29
30
31
32
33[root@ol75elk74s elasticsearch-head]# nohup npm run start &
[1] 31200
[root@ol75elk74s elasticsearch-head]# nohup: ignoring input and appending output to ‘nohup.out’
[root@ol75elk74s elasticsearch-head]#
[root@ol75elk74s elasticsearch-head]# ll
total 248
drwxrwxr-x 2 root root 4096 Oct 22 02:36 crx
-rwxrwxr-x 1 root root 248 Oct 22 02:36 Dockerfile
-rwxrwxr-x 1 root root 221 Oct 22 02:36 Dockerfile-alpine
-rwxrwxr-x 1 root root 104 Oct 22 02:36 elasticsearch-head.sublime-project
-rwxrwxr-x 1 root root 2240 Oct 22 02:36 Gruntfile.js
-rwxrwxr-x 1 root root 3482 Oct 22 02:36 grunt_fileSets.js
-rwxrwxr-x 1 root root 1100 Oct 22 02:36 index.html
-rwxrwxr-x 1 root root 559 Oct 22 02:36 LICENCE
drwxr-xr-x 375 root root 12288 Oct 22 02:49 node_modules
-rw------- 1 root root 185 Oct 22 03:04 nohup.out
-rwxrwxr-x 1 root root 886 Oct 22 02:36 package.json
-rw-r--r-- 1 root root 168896 Oct 22 02:49 package-lock.json
-rwxrwxr-x 1 root root 100 Oct 22 02:36 plugin-descriptor.properties
drwxrwxr-x 4 root root 4096 Oct 22 02:36 proxy
-rwxrwxr-x 1 root root 7186 Oct 22 02:36 README.textile
drwxrwxr-x 5 root root 4096 Oct 22 02:36 _site
drwxrwxr-x 5 root root 4096 Oct 22 02:36 src
drwxrwxr-x 4 root root 4096 Oct 22 02:36 test
[root@ol75elk74s elasticsearch-head]# more nohup.out
> elasticsearch-head@0.0.0 start /u01/elasticsearch-head
> grunt server
Running "connect:server" (connect) task
Waiting forever...
Started connect web server on http://localhost:9100
中文分词插件IK(TBD)
Logstash
安装Logstash
安装和Elasticsearch类似,不再累述1
2
3
4
5cd /u01/logstash/
tar -xvf logstash-7.4.0.tar.gz
ln -s logstash-7.4.0/ latest
cd latest/bin/
./logstash -e 'input { stdin { } } output { stdout {} }'
-e代表使用后面单引号里面带的配置字符串开启一个pipeline,而不是通过配置文件去启动pipeline
注意:
-e 后面也可以不跟任何输入输出配置,这样会启动默认配置的pipeline
- 默认的输入为
input { stdin { type => stdin } }- 默认的输出为
output { stdout { codec => rubydebug } }
1 | [root@ol75elk74s bin]# logstash -e 'input { stdin { } } output { stdout {} }' |
如上在命令行终端直接输入Hello,可以看到输出的数据已被格式化,自动加上版本,时间戳以及hostname
Log采集插件Filebeat
filebeat是数据采集插件,可以把多个服务器上的多个log文件采集给Logstash或Elasticsearch
注意:
- 也就是说filebeat采集到的数据可以发送给logstash,也可以不通过logstash直接发送给elasticsearch
Filebeat插件安装
安装过程不再累述1
2
3
4
5
6
7cd /u01
mkdir filebeat
mv ~/Downloads/filebeat-7.4.0-linux-x86_64.tar.gz /u01/filebeat/
cd filebeat
tar -xvf filebeat-7.4.0-linux-x86_64.tar.gz
rm filebeat-7.4.0-linux-x86_64.tar.gz
ln -s filebeat-7.4.0-linux-x86_64/ latest
环境变量写入配置文件/etc/bashrc
1 | #filebeat |
准备测试数据
官方测试数据下载链接 Link, 放到/u01/testdata目录下
设置配置文件filebeat.yml
将enable设为true,代表1
2
3
4
5
6
7
8
9
10
11
12
13
14
15
16
17#=========================== Filebeat inputs =============================
filebeat.inputs:
# Each - is an input. Most options can be set at the input level, so
# you can use different inputs for various configurations.
# Below are the input specific configurations.
- type: log
# Change to true to enable this input configuration.
enabled: true
# Paths that should be crawled and fetched. Glob based paths.
paths:
- /u01/testdata/*
#- c:\programdata\elasticsearch\logs\*
History
v1.0,2019.10.14~2019.10.24,初始版本
本文作者 : Shen Peng
原文链接 : http://yoursite.com/2019/10/22/通过ELK集中管理Windows-Server日志/
版权声明 : 本博客所有文章除特别声明外,均采用 CC BY-NC-SA 4.0 许可协议。转载请注明出处!
知识 & 情怀 | 二者兼得